How To Do IELTS Academic Writing Task 1

IELTS coachHello everyone! Former IELTS examiner Tim James here (pictured), and on this page I am going to show you exactly how to do IELTS Academic Writing Task 1. Here's what to do:

Firstly, analyse the question and visual data, and then plan your answer. Secondly, write an introduction paraphrasing the title of the visual data. Thirdly, write an overview paragraph. Next, add two details paragraphs before finally checking your answer.

This is the exact same method I have personally taught time and again to international students around the world and so I know it works!

Now, let's get started right away by saying the IELTS Academic Task 1 is very different to the General IELTS test. Candidates need to summarise visual data into a minimum of 150 words.

The visual data may appear as any of the following: line graphs, bar charts, pie charts, tables, maps, or flow diagrams. Sometimes you may have more than one of these to summarise.

I recommend that you spend 20 minutes on task 1 which leaves you with 40 mins to complete the essay task afterwards.

This page is now going to cover:

  1. Sample questions and answers (pdf available)
  2. The step-by-step writing process
  3. How to get a band 7, 8, or 9
  4. Useful vocabulary and language (pdf available)
  5. Summary writing tips
  6. Links to more specific lessons

Sample Questions And Answers

There are 7 different question types that you may face on test day. Each different question type features a different form of visual data/information. So, although in this task you will always have to use your summary skills, the visual data can come in different forms. Let's see what they could be now.

Process Diagrams

The diagram below shows the process by which bricks are manufactured for the building industry.

Summarise the information by selecting and reporting the main features, and make comparisons where relevant.

Model Answer +

The illustration demonstrates the method by which bricks are produced for the construction industry.

Overall, the process begins with clay being extracted from the ground and finishes with the bricks being delivered to industry. It is a 7 step, linear, man-made process.

First of all, clay is dug out of the ground by an excavator and placed on a metal grid which aids in breaking down lumps of clay into smaller parts. Sand and clay are then added to the smaller lumps of clay and a mixture is created. This is then either poured into molds or cut by wire to form brick shapes.

These newly formed bricks are then stored in a drying oven for between 24 and 48 hours. Once the bricks are dried they are transferred to a kiln where they are kept at a temperature of 200C – 1300C. After this, the bricks are allowed to cool for between 48-72 hours before they are delivered by lorry to be used in the construction industry.

Word count 167

Teaching Points +

The fluency and coherence of this summary is particularly good. The writer has used a variety of linking words and phrases accurately. Furthermore, the 4 paragraph structure used is clear and provides an effective framework for the content of the summary.

Estimated band score: 9


Tables

Model Answer +

The table provides information regarding consumer expenditure on a variety of products in five different countries.

Overall, it is clear that in each country the most amount of money spent was on the food, drinks and tobacco category. The lowest percentages recorded were for the leisure and education category in each country.

Consumer spending on food was significantly higher in Turkey, at 32.14%, with Ireland close behind at 32.14%. Outgoings on spending and leisure was also highest in Turkey, at 4,35%, whereas spending on clothing and footwear was noticeably higher in Italy, at 9%, when compared to the other countries.

The figures show that Sweden had the lowest level of consumer spending on food/drink/tobacco and for clothing/footwear with 15.77% and 5.4% respectively. Although, Spain recorded percentages slightly higher than these they did record the lowest amount of consumer spending for the leisure/education category at just 1.98%.

Word count 146

Teaching Points +

For a band 9 band score in grammar the IELTS band marking criteria state that candidates need to use a wide range of structures with full flexibility and accuracy (band marking criteria)

The candidate achieves this by using complex sentence structures, such as:

Outgoings on spending and leisure was also highest in Turkey, at 4.35%, whereas spending on clothing and footwear was noticeably higher in Italy, at 9%, when compared to the other countries.

Notice that the sentence has 2 main clauses joined together by the linking word 'whereas' and that punctuation i.e. commas, are used appropriately.

Furthermore, the phrase 'noticeably higher' is a very natural sounding phrase that a native speaker would be likely to use, this therefore will help the lexical resource/vocabulary score, as will use of the word 'respectively', which is a less common word typically used in academic writing.

Finally, note that the length of the summary is just 146 words and it should be at least 150 words. In this case, the band score is likely to be unaffected as the summary is written successfully and all main points are covered.

The word limit exists to ensure that you are providing a large enough sample of writing for examiners to judge you on, it is normally difficult to successfully complete a thorough summary or essay in less than the given word limit. So, if you are well under the word limit then you need to consider whether you have developed your ideas/main points sufficiently.

Estimated band score: 9


Maps

The maps below show the changes that have taken place at the seaside town of Brinslow between 1990 and 2005.

Summarise the information by selecting and reporting the main features, and make comparisons where relevant.

Model Answer +

The illustration reveals the extent of changes in the coastal town of Brinslow over the period of time from 1990 to 2005.

To summarise, Brinslow has seen extensive changes in terms of type and layout of housing and in general transportation and infrastructure.

When comparing 1990 with 2005, it can be seen that the road and rail networks have been developed with the addition of a new railway line built along the south coast. A ferry port has also been built just south of the railway station in addition to an airport located north west of the school. However, the original school, hospital, and car park have remained and a few extra houses have been constructed nearby on an area previously covered with trees. A factory has also been built on a previously wooded area.

In the north west area, the large mansion and its grounds have been demolished and an apartment bock has been erected. Multiple small houses have also been built along the main road to the railway station. The south west area has been completely transformed with two large apartment blocks, a supermarket and an extra access road being built on what was previously an area offering limited housing.

Word count 180

Teaching Points +

For a band 9 band score in grammar the IELTS band marking criteria state that candidates need to use a wide range of vocabulary with very natural and sophisticated control of lexical features (band marking criteria).

The candidate achieves this by using a range of word related specifically to the building industry, this means that instead of words like 'change, made, or it's different', the writer uses expressions such as: remained, built, demolished, erected, constructed, and transformed. These words alongside other natural phrases such as 'type and layout of housing, wooded area, infrastructure and access road' indicate to the examiner that they are fulfilling the band 9 criteria.

So, you can see that is the choice of words that related specifically to the situation that make the words higher level. Always try to be specific in your answers and try to come up with the words and phrases directly related to that topic.

Estimated band score: 9


Chart Table Combinations

The pie chart below shows the main reasons why agricultural land becomes less productive. The table shows how these causes affected three regions of the world during the 1990s.

Summarise the information by selecting and reporting the main features, and make comparisons where relevant.

Model Answer +

Combined, the pie chart and table reveal the reasons for land degradation collectively around the world and by region.

Overall, the percentage of degraded territory by all causes in Europe was significantly higher than North America and Oceania. Furthermore, both over-grazing and deforestation were relatively similar and continued being the main causes for agricultural land becoming less productive, a great deal of the land was degraded by over-grazing.

According to the pie chart, 30% of international causes of land degradation came down to deforestation, 35% for overgrazing, and 28% being due to over-cultivation. The other category amounted to just 7%.

Referring to the table, the highest percentage of land degraded by all causes was was in Europe at 23% which was significantly higher than Oceania at 13% and North America at 5%. Europe registered the highest percentages across all categories apart from the overgrazing category which Oceania recorded the highest percentage at 11.3%.

Word count 153

Teaching Points +

For a band 9 band score in grammar the IELTS band marking criteria state that candidates need to clearly present a fully developed response (band marking criteria).

The candidate achieves this to a certain extent, however, the second details paragraph could have developed comparison between the countries more and therefore, whilst, overall the response probably scores a band 9, in the Task Achievement band it would probably only reach a band 8.

Estimated band score: 9


Line Graphs

The line graph below shows changes in the amount and type of fast food consumed by Australian teenagers from 1975 to 2000.

Summarise the information by selecting and reporting the main features and make comparisons where relevant.

Model Answer +

The line graph represents the amount of fast food consumed by adolescents in Australia over recent decades.

Overall, it is clear that the amount of fish and chips has significantly reduced by about half, whereas, intake of both pizza and hamburgers has grown a great deal.

Firstly, the amount of fish and chips eaten by Australian teenagers declined dramatically from 95 times per year in around the year 1985 down to 38 times per year in approximately the year 1997. Prior to this, consumption had fluctuated but never dropped below the 80 times per year mark.

Pizza consumption began at around 5 times per year in the mid-70s before growing at a fast pace to approximately 85 times per year in the mid-90s. Hamburgers experienced a similar rapid increase in popularity beginning at just 10 times per year in the mid-70s and recording a value of around 85 times per year in the mid-90s before its consumption rate slowed significantly prior to leveling off at around 100 times per year from the mid-90s onwards. Similarly, pizza’s growth in sales also plateaued at around 85 times per year from the mid-90s onwards too.

Word count 191

Teaching Points +

For a band 9 band score in grammar the IELTS band marking criteria state that candidates need to clearly present a fully developed response (band marking criteria).

The candidate produces a fully developed response in a clear structured manner. The only real errors are the use of the word 'adolescent' as a synonym for 'teenagers'. This is not quite right as 'adolescents' can be any age from 10-19, according to the World Health Organisation.

The word 'consumption' is used a number of times but this is acceptable. It is better to use the same word rather than use other words that do not quite fit accurately.

Estimated band score: 9


Pie-charts

The two pie charts below show the online shopping sales for retail sectors in Canada in 2005 and 2010.

Summarise the information by selecting and reporting the main features, and make comparisons where relevant.

Model Answer +

The two pie charts provided reveal the percentage of sales made online by the four main retail sectors in Canada in both 2005 and 2010.

During this time period the food and beverage industry experienced the highest level of online growth and video games market share also modestly increased. However, sales of home furnishings online suffered greatly and produced the largest drop in market share with sales of electronic appliances also experiencing a loss in their online market share.

Online sales in the food and beverage industry dramatically increased by 10% during the 5 year time period to 32% overtaking the previous market leader, sales of electronics and appliances. Sales of video games also grew but by only half as much at just 5%. However, their market share still did not reach 25% of the overall market falling 2% short of this mark.

Furthermore, sales of home furnishings plummeted by 10% to receive the lowest market share in 2010 and previous market leader sales of electronics and appliances  experienced a substantial decrease in market share of 10% leaving it with the second largest market share overall.

Word count 184

Teaching Points +

This response flows particularly well. There is a range of linking words present and a 4 part structure to the response. There is also a good mix of simple, compound and complex sentences demonstrating good control of grammar and the candidate has made good use of adverbs to describe the trends accurately, e.g. greatly, significantly, substantially. These all add to the the accuracy of the summary.

Estimated band score: 9


Bar charts

The chart below shows the number of men and women in further education in Britain in three periods and whether they were studying full-time or part-time.

Summarise the information by selecting and reporting the main features, and make comparisons where relevant

Model Answer +

The bar chart reveals the number of males and females pursuing further education in either a part-time or full-time capacity over three different years a decade apart.

Overall, it is clear that the number of women undertaking education in either a full time or part time capacity has significantly increased, whereas, the numbers for men only increase for part-time study.

The figures show that in 1970/71 one million males were in further education, this number fluctuates but remains high at 900,000 in 1990/91. The number of men in part-time education steadily increases each decade from 100,000 in 1970/71, to 175,000 in 1980/81 and then it reaches approximately 220,000 in 1990/91.

The number of women in full-time education on the other hand, grows dramatically from around 700,000 in 1970/71 to around 1.1 million in 1990/91. The number of women in part-timed education also grow from around 50,000 females in 1970/71 to around 200,000 in 90/91.

Word count 154

Teaching Points +

For a band 9 band score in grammar the IELTS band marking criteria state that candidates need to clearly present a fully developed response (band marking criteria).

The candidate produces a fully developed response in a clear structured manner. The only real errors are that the response could have included more details, for example, comparisons could easily have been made between the increases in male and female participation.

Estimated band score: 9

If you prefer you can also download the above sample questions and answers here in pdf format if this is preferable for you:

IELTS Academic Training Writing Task 1 Sample Questions pdf


The 6 Step Writing Process

Follow this step-by-step process to produce well structured summaries that please the examiners and are similar to the sample/model answers I have show you above. We believe this is how to do  IELTS Academic Writing Task 1 in the most efficient way. You can either watch the video or read the flow chart summary underneath.

  1. Analyse the question and identify 2-4 key features. The question instructions are always the same but the visual data needs analysing carefully so that you can correct the most appropriate features for your over view.  Read how to do this here: How To Analyse and Select Key Features.
arrow

2. Write your opening sentence/introduction. This sentence will basically be a paraphrase of the question statement, which is the first sentence in the question box. It will tell the reader what the visual data is showing us in their own words. Read How To Write Your Introduction Here.

arrow

3. Write an over view. This will be your second paragraph where you will use the key features you have already identified to create a sentence or two that tells the reader what the main patterns or trends the data is showing us are. Read more here: How To Write An Over View.

arrow

4. Write details paragraph 1. Here you can describe in detail by using the information you are given (numbers and figures) how the data changes over time, or what differences there are between different groups of data. Watch the video here about summarising tables to see how to write your details paragraphs.

arrow

5. Details paragraph 2. Here, if possible, you should make detailed comparisons between different groups of data. If this is not possible you should continue to describe various individual trends or patterns in detail, again by making use of the numbers and figures presented. Watch the video here about summarising tables to see how to write your details paragraphs.

arrow

6. Check your summary. An essential part of writing is to check for errors. This is really important in IELTS tests as simple mistakes can effect your band score.

The more you practice this process the more confident you will become. Following the same process each time helps to eliminate nerves on exam day, it prevents you from making silly mistakes and means you will produce a well structured essay every time.


How To Get A Band 7, 8 Or 9

Discover how to give the examiners exactly what they want by understanding the band descriptors for IELTS academic writing. All explained in the video below:


Useful Language and Vocabulary

Make sure you know at least 3 of these words from each category from the tables below AND that you are able to use them accurately in a sentence. Also, be aware that whilst many of the words have similar meanings they are not exactly the same. I recommend that you see how they are used in news articles and magazines to get a proper idea of there slight difference in meanings.

You could also use a 'corpus' is a huge database of examples of English language in use an you can use it to show you examples of how these words are used. Simply type in the word you are looking for and you will be given lots of example sentences, pretty cool!

Useful Nouns

(For describing trends over time)


GOING UP: surge, growth, increase, rise, boom, peak

GOING DOWN: drop, fall, slump, decline, decrease, dip, reduction, plunge

GOING UP AND DOWN: variation, fluctuation, undulation

NO CHANGE: plateau, period of stability, leveling off

Useful Adjectives

(For describing trends over time)


LARGE CHANGE: sharp, vast, rapid, considerable, significant, steep, dramatic, swift, great

SMALL CHANGE: slight, modest, moderate, gradual, negligible, minor

Useful Adverbs

(For describing trends over time)


LARGE CHANGE: sharply, vastly, rapidly, considerably, significantly, steeply, dramatically, swiftly, greatly

SMALL CHANGE: slightly, modestly, moderately, gradually, negligibly

You can also download a copy of the above IELTS Academic vocabulary pdf if you prefer.


IELTS Academic Summary Writing Tips

Tip 1: Select the actual main features

Take time to analyse the question AND what the main features it is showing are. Remember, 'main features' does not mean just any 3 numbers you can read from the visual data. It means that you need to look at, study and interpret what the main trends that the graph/chart/table is showing.

The numbers/features that you pick should link to what the overall trends are. Just giving the highest or lowest number is usually not a main feature and if you give those random type details as your main features then you will not be summarising the information and you will definitely lose marks for Task Achievement.

So, take your time to really read, understand and interpret what the overall trends are from the graphs/charts you are given.

Tip 2: Write an overview paragraph.

Many students skip this step and their band score suffers as a result. All you need to do is write a short paragraph, just 2 sentences saying what the two or three main points of the visual data are.

You do not include any details/numbers in this paragraph but be careful that you write about the main trends/points that the visual data shows. Do not write about random things, such as, the highest or lowest numbers if there is no reason too, you might want to do that in the details paragraph when making comparisons.

Tip 3: Be careful with synonyms

Whilst you absolutely should be using synonyms to restate the title of the visual data in the first sentence of your answer, you should only be doing so when you are sure that your synonyms match correctly.

This can be tricky, for example, you might want to substitute the word vehicle for car, however, are they really synonyms? Cars normally refers to four wheeled cars, whereas vehicles include lorries, vans, motorcycles and so on, these are clearly not the same.

Therefore, if you cannot think of good synonyms for the words in the question, don’t worry, just use the same words but you might look for another way to rewrite the title, such as, switching the clauses around, or altering the word order in some other way which will show the examiner that you have good control of grammar.

Tip 4: Practice different question types.

There is no worse feeling than turning up on test day having prepared really well for line graphs and charts because you think you are most likely to get them and then you actually get a ‘maps’ question.

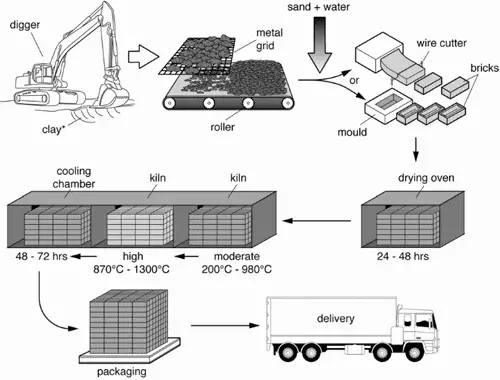
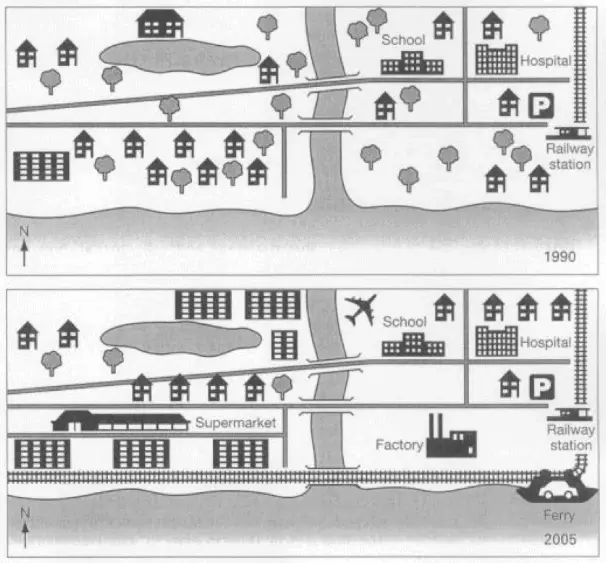
Maps and process diagrams in particular need to be prepared for separately as they have their own specific type of language and vocabulary which goes with them. Don’t try to cut corners just prepare properly in the first place.

Tip 5: No conclusion

They would basically be the same thing. In my method described above, you will see that I recommend always having an overview paragraph as your second sentence and no conclusion.

Tip 6: Do not write specific numbers

Unless you are certain they are correct do not write specific numbers. IELTS are great at supplying line graphs where it is difficult to tell what they exact number is.

In this case, it is better to use the words approximately, nearly, or just under, rather than simply guessing. See it as another way to show how good your English is. If you do not do this then you are in danger of describing the data incorrectly and will lose marks for task achievement.

Tip 7: Play safe with your grammar

Be aware that you will lower your band score if you try to use more advanced grammar incorrectly. It is often better to ‘play safe’, i.e. use sentence structures, words and phrases that you are 100% sure about. In this way you can minimise your errors and hopefully get a higher band score.

Tip 8: Structure, structure, structure

Always make sure that you structure your response clearly and effectively. If you do not it can be very difficult for the reader to gain a clear idea of what you are summarising.

A good summary should mean that the reader can actually go away and draw out the information and get it quite close to the real thing. I recommend using and practising writing using the 6 step process above. If you follow this every time, you will feel more confident on test day, you won’t miss out any important steps and you will write a well-organised summary that is nice and clear for the examiners.

Tip 9: Make sure you write enough

It is a nice idea to have a few practise goes under timed pressure and on IELTS official answer paper. This will mean you know how many lines you should be writing on the actual test paper and you must absolutely get used to working under timed pressure. Many students fail to do this and then on test day they end up running out of time and not writing enough.

Tip 10: Feedback

Finally, you should always be seeking feedback on your practise attempts, otherwise, how will you know what mistakes you are making and how to get better? Ideally, this would be someone with experience of IELTS such as a suitable teacher, or examiner. Here is one resource I highly recommend you use to get that feedback quickly and easily.


IELTS Academic Writing Task 1 Question Types

As you may know there are at least 6 different types of IELTS Academic Task 1 questions that you may face. You can use the above process for each of the different question types. However, you may want to see example questions and model answers to see how this is done, so take a look at the following links:

IELTS Academic Writing Task 1 Bar charts

IELTS Academic Writing Task 1 Pie Charts

IELTS Academic Writing Task 1 Tables

IELTS Academic Writing Task 1 Multiple Charts

IELTS Academic Writing Task 1 Maps

IELTS Academic Writing Task 1 Process Diagrams