How To Do IELTS Academic Writing Task 1 Bar-charts
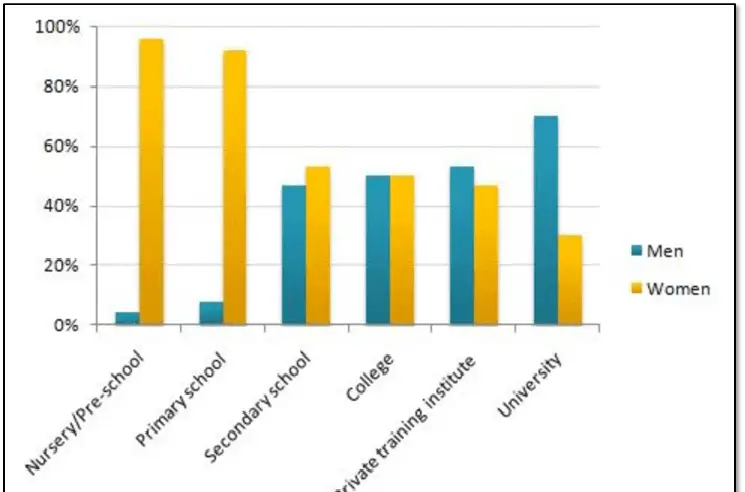
The chart below shows the percentage of male and female teachers in six different types of educational setting in the UK in 2010.
Summarise the information by selecting and reporting the main features, and make comparisons where relevant.
MODEL ANSWER
The bar chart reveals in percentages the gender split of teaching staff employed in six separate types of educational institutions in the UK in 2010.
Overall, nursery and primary school teachers are overwhelmingly women. However, approximately twice as many university professors are male, leaving an approximately equal split of male and female teachers in secondary schools, colleges and private training institutes.
As regards nursery and pre-school, the percentage of women employed as teachers was approximately 95%. This figured dipped slightly to around 92% in primary schools and then significantly decreases to about 55% of secondary school teachers. Subsequently, it falls by around 2-4% for colleges and then again for private institutes. Finally, there is a much greater drop off of around 15% to approximately 30% of teachers being female in universities.
Males on the other hand, reached their peak of approximately 70% of teachers at university level. This level was reached from a low of 5% in nursery and pre-school and around 8% in primary schools. There was then a much higher number of male teachers in firstly, secondary schools at 45%, colleges at 50% and private institutes at 55%. (190 words)
Teaching Points: Notice how the first paragraph is simply a repeat of the statement in the actual question which tells you what the bar-chart is all about. All you need to do is repeat this again but by using your own words through synonyms and paraphrasing as much as possible. This shows the examiner that you have a good range of vocabulary and it is a logical way to begin your summary.
IELTS Writing Task 1 (Academic)
Discover how to describe all types of visual data that you may see in this part of the test.

Sshhhhh! Listen closely, here are some valuable tips, techniques and strategies for maximising your listening band score.

IELTS Writing Task 1 (General)
Discover how to write in the correct format and tone for this part of the test.

Learn 'what' to say and 'how' to say it in each part of the test to impress the examiner.