IELTS Academic Writing Task 1
involves candidates either describing facts and figures, the stages of a process, how something works, or an object or an event. Candidates have 20 minutes to write a minimum of 150 words.
 The information that candidates need to write about is given to them visually in the form of a picture,
graph, bar chart, table or diagram, we’ll call this ‘visual data’.
In this article the band descriptors that examiners use when marking writing tests will be referred to so you can see exactly why/how to get a high band score.
You can see them here: IELTS Academic Band Descriptors.
If you are not sure what these bands mean, then read the introductory section here first: IELTS Writing Overview.
Fast Track To A Band 7+ With My Proven Course!

First Steps…
It is essential to be able to understand the visual information first, so take a few moments to carefully examine the visual data, this means paying specific attention to the labels used.
Selecting the relevant data to use can be tricky, and this is one of the four skills assessed known as Task Achievement (which means actually answering the question).
The first step to doing this effectively is to identify the key words in a question; this will tell you what information to select from the visual data (graph or chart etc…). Here is an example question:
Example Question: IELTS Academic Task 1
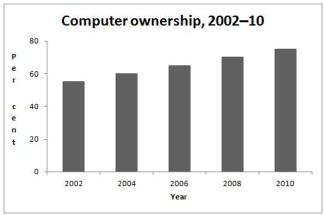
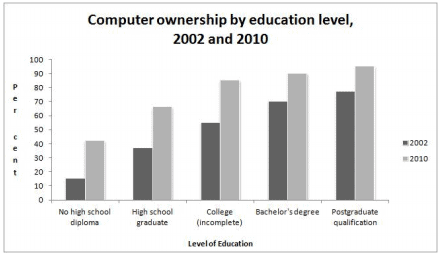
The graphs below give information about computer ownership as a percentage of the population between 2002 and 2010, and by level of education for the years 2002 and 2010.
Summarise the information by selecting and reporting the main features, and make comparisons where relevant.
Visual Data:
How To Get Started?
As you can see, I have underlined the key words in this question. Next, I need to use those keywords to ask myself questions about the visual data.
Here are some questions I might ask myself, remembering that we are looking for main features:
– Which year had the highest and lowest levels years in terms of ownership and as a percentage?
– Is there are an overall trend in the two different methods of measurement?
The answers will help you write your second paragraph and comparing them will help with your third paragraph.
How Many Paragraphs And What Should I Write?
The actual structure of your answer should be like this:
Paragraph 1: Use your own words to say what the visual data shows. Use the titles and labels of the graphs, charts and diagrams to do this.
Paragraph 2: State what the main overall trends are.
Paragraph 3: Analyse the data using your own words giving specific numbers and figures and statistical comparisons.
Paragraph 4: Comment once more on the overall trends.
The model answer below follows this exact structure which makes it easy to see what the purpose of each paragraph is. You should use this exact same structure as it is recommended by Cambridge themselves.
IELTS ACADEMIC WRITING TASK 1 – Model Answer To The Above Question:
The bar charts show data about computer ownership, with a further classification by level of education, from 2002 to 2010.
A steady but significant rise can be seen in the percentage of the population that owned a computer over the period. Just over half the population owned computers in 2002, whereas by 2010 three out of four people had a home computer.
An analysis of the data by level of education shows that higher levels of education correspond to higher levels of computer ownership in both of those years. In 2002, only around 15% of those who did not finish high school had a computer but this figure had trebled by 2010. There were also considerable increases, of approximately 30 percentage points, for those with a high school diploma or an unfinished college education (reaching 65% and 85% respectively in 2010). However, graduates and postgraduates proved to have the greatest level of ownership in 2010, at 90% and 95% respectively, 20 percentage points higher than in 2002.
The last decade has seen a substantial growth in computer ownership in general, and across all educational levels.
End of Model Answer (Source: British Council).
Fast Track To A Band 7+ With My Proven Course!
How To Get A High Band Score
There is a clear structure to this that answer anyone can follow, including you!
Now let’s break down this answer into three further areas that it will be graded for, remembering the first area, which was Task Achievement:
Lexical Resource (vocabulary) – Even in the first sentence the writer has not repeated the words given in the chart titles. They have used the words ‘bar charts’ instead of ‘graphs’ and ‘further classification’ rather than ‘computer ownership by education level’.
So, through the use of synonyms they are displaying a variety of vocabulary which will gain a higher grade band.
For a band score of 6, test takers need to show an adequate range of vocabulary’ and for a 7 they need to display a ‘sufficient range of vocabulary to allow some flexibility and precision.
Using adjectives and adverbs is an excellent way of demonstrating this. Take a look at these examples from the model answer:
1. significant rise
2. substantial growth
3. considerable increases
All of the phrases basically mean the same but the writer has chosen to show a variety of language and to be precise through the use of adverbs and adjectives.
Grammatical Range – If a candidate uses a limited range of structures they will not score more than a band 5, however with the use of some complex sentences they can get into band 6 for grammatical range.
Here are some examples of how you could make comparisons, try to use all of these in your response if possible:
♦ The number of X was as (adjective) as Y.
♦ The number of customers in 2010 was as high as in 2011.
♦ The amount of X was (multiples, e.g. double, triple, half) the amount of Y.
♦ The amount of spending on cars was triple the amount of spending on clothes.
♦ There were (comparative) X than Y.
♦ There were more male customers than female customers.
Using these different ways to compare means that you are using different grammatical structures and therefore making the examiner happy 🙂 You do not have to try to use all the different tenses you know.
Using the above structures is all you need to do to show the range of grammatical structures that examiners want to see.
How To Make Your Writing ‘Make Sense’
Coherence and Cohesion – For candidates to achieve a band 6 for Coherence and cohesion, they have to ‘arrange information coherently’ and ‘use cohesive devices effectively’.
Often in the IELTS Academic Writing task 1, students will have to describe a process or a series of events from a chart. In this situation linking words such as:
firstly, secondly and after that would be good examples of words that provide order to the reader.
In the model answer above these phrases give direction to the text and signal to the reader what is going to happen next, here are some more examples:
…whereas…= a comparison is going to be made, …there were also… = more information is going to follow, an analysis of the data shows… = the start of a trend description.
It is these types of words and phrases which provide the framework for the detail in between, these words/phrases score you the marks for coherence and cohesion
So, let’s summarise How To Do IELTS Academic Writing Task 1 with a few do’s and don’ts.
Fast Track To A Band 7+ With My Proven Course!
Important Rules To Follow!
Do's:
♦ Write in full sentences.
♦ Start with an overview.
♦ Write about the data in your own words.
♦ Highlight main trends before details.
♦ Use facts from the visual data to support your points.
Don’ts:
♦ Copy out the question.
♦ Invent or include information that is not in the question.
♦ Describe everything you see.
♦ Give reasons for the information given.
Any questions or comment please let me know below!
Where To Next?
How To Do IELTS Writing Task 2
How To Improve Your IELTS Writing Vocabulary